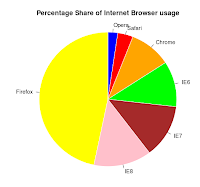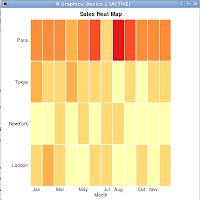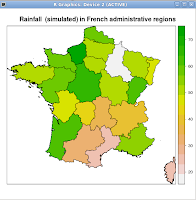
These are all graphs I produced with the book's samples.


They all know how to produce compelling presentations. While some of the above are good programmers (even excellent ones), we don't know of them because of that. We know of them because they influence our thinking. Every programmer who advances through the ranks eventually gets to the point where they need to influence people as well as sling code. (It's all about scalability. One person can only do so much-- but if that one person can effectively influence a group of others-- then the reach of that coder is greatly expanded.) So too it should be with you-- you need to learn how to produce artifacts that will influence people and bolster your arguments.
To that end, I am really pleased with "R Graphs Cookbook" by Packt. If you haven't used R yet-- regardless of whether you read this book or not-- you need to download this excellent open source statistical package and get yourself acquainted. Search this blog for examples, I've posted a few. R makes statistics easy, and statistics can lend assistance to everything from log analysis to garbage collection optimization. This book is about R's excellent graphical capabilities, though.
This book doesn't teach R, and it's target audience is an experienced R programmer. I really think even an R novice could use this book to produce impressive graphs, though-- each recipe is very short and shows what's needed to produce the graph you're after. By the way, I think one of the best parts of this book is the available source code-- you don't even have to type in the examples, and the sample data is invaluable. By the way, studying the way the data is structured is highly educational. I'd strongly recommend examining the data with each recipe to maximize your learning.
The book teaches you how to draw all kinds of graphs: scatter plots, line plots, pie graphs, bar charts, histograms, box and whisker plots, heat maps, contour maps and regular maps. The 'regular maps' covers maps of the world, a country, a state, etc.
If I had a wish to improve this book, I'd wish for a comprehensive index that covers every page where a specific function or argument was used. Sometimes functions are demonstrated in one graph recipe that could be useful in making a different kind of graph-- but if you don't know where to look for the example, it could be difficult to find. It's an omission I can live with, though.
This book will get a spot on my reference shelf. For those occasions where I need to produce the proverbial picture worth a thousand words, I know where I'll reach.
The book can be found here.
Happy Graphing!
1 comment:
I have no words for this great post such a awe-some information i got gathered. Thanks to Author.
Post a Comment